Marketing
How to Make Google Analytics Work for Your Restaurant Website
December 20, 2017
An easy to follow, step-by-step guide
For restaurant operators, Google Analytics has a wealth of information that can help you better understand your guests, how they use your restaurant website, and ultimately improve their entire hospitality experience. Still, it can be a challenge to unlock all of the insight that Google Analytics has to offer. Fortunately, it’s simple once you know where to look. Below are some restaurant website metrics we recommend checking out, with step-by-step guides on where to find this information.
Set up Google Analytics
First things first: Make sure you have a Google Analytics account set up and that it’s properly tracking your website. If you are a BentoBox customer, we make it easy to get set up through our pre-built Google Analytics integration. If you’re on your own, there are many step-by-step resources that can help you get everything in order. Once that’s done, here’s what to pay attention to.
How people are visiting your website
By knowing what devices and browsers your guests are using to access your website, you can ensure that you’re giving them all of the information they need quickly and easily. It’s helpful to know, for example, if most people are visiting your website from their mobile device or tablet, so that you can you make sure to have a responsive, fast-loading website with all of your pertinent information on display front and center.
In order to see what devices and browsers your visitors are using, first log in to Google Analytics and click on “Audience” on the left hand side. Make sure you’re on the correct account for your restaurant.
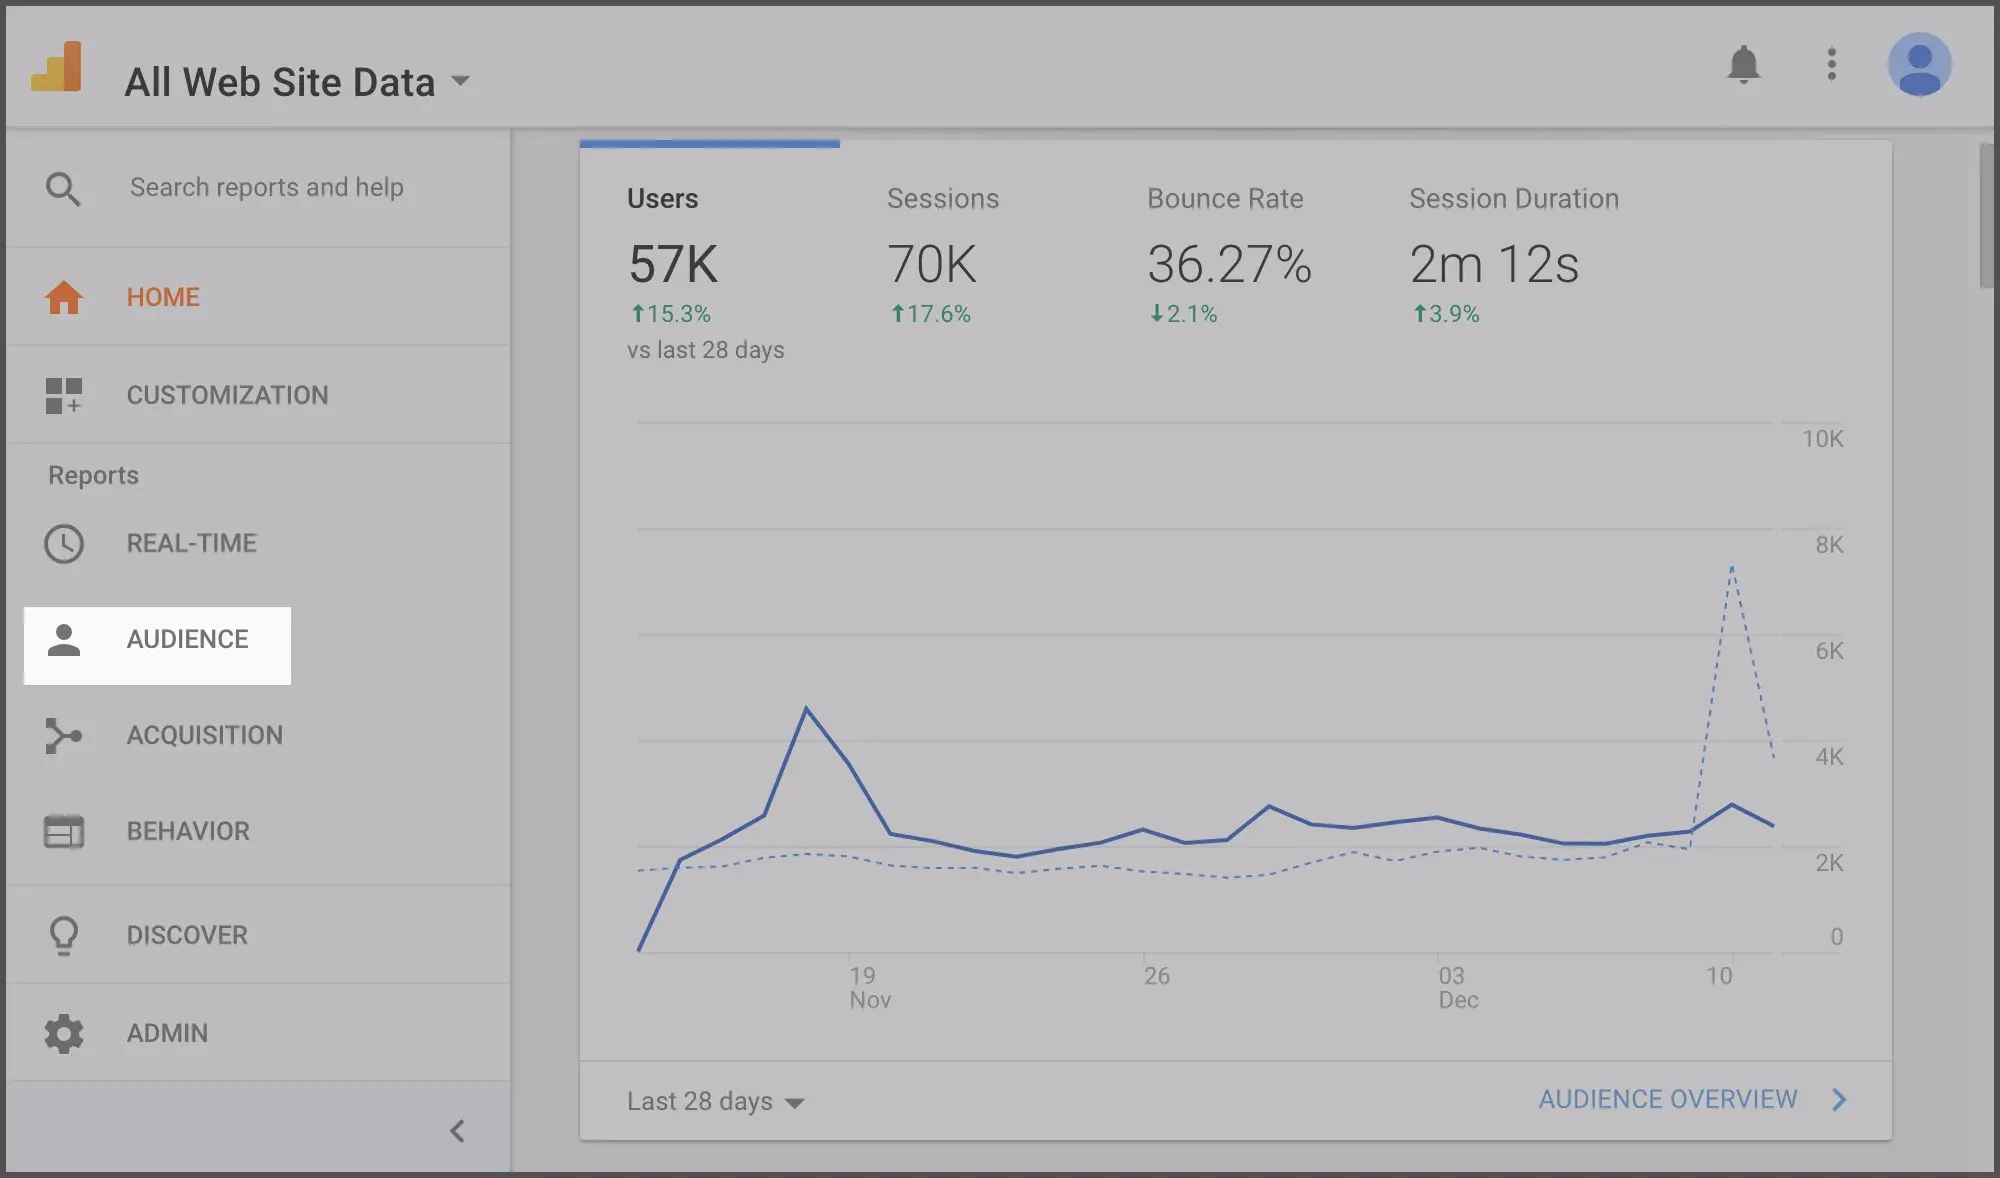
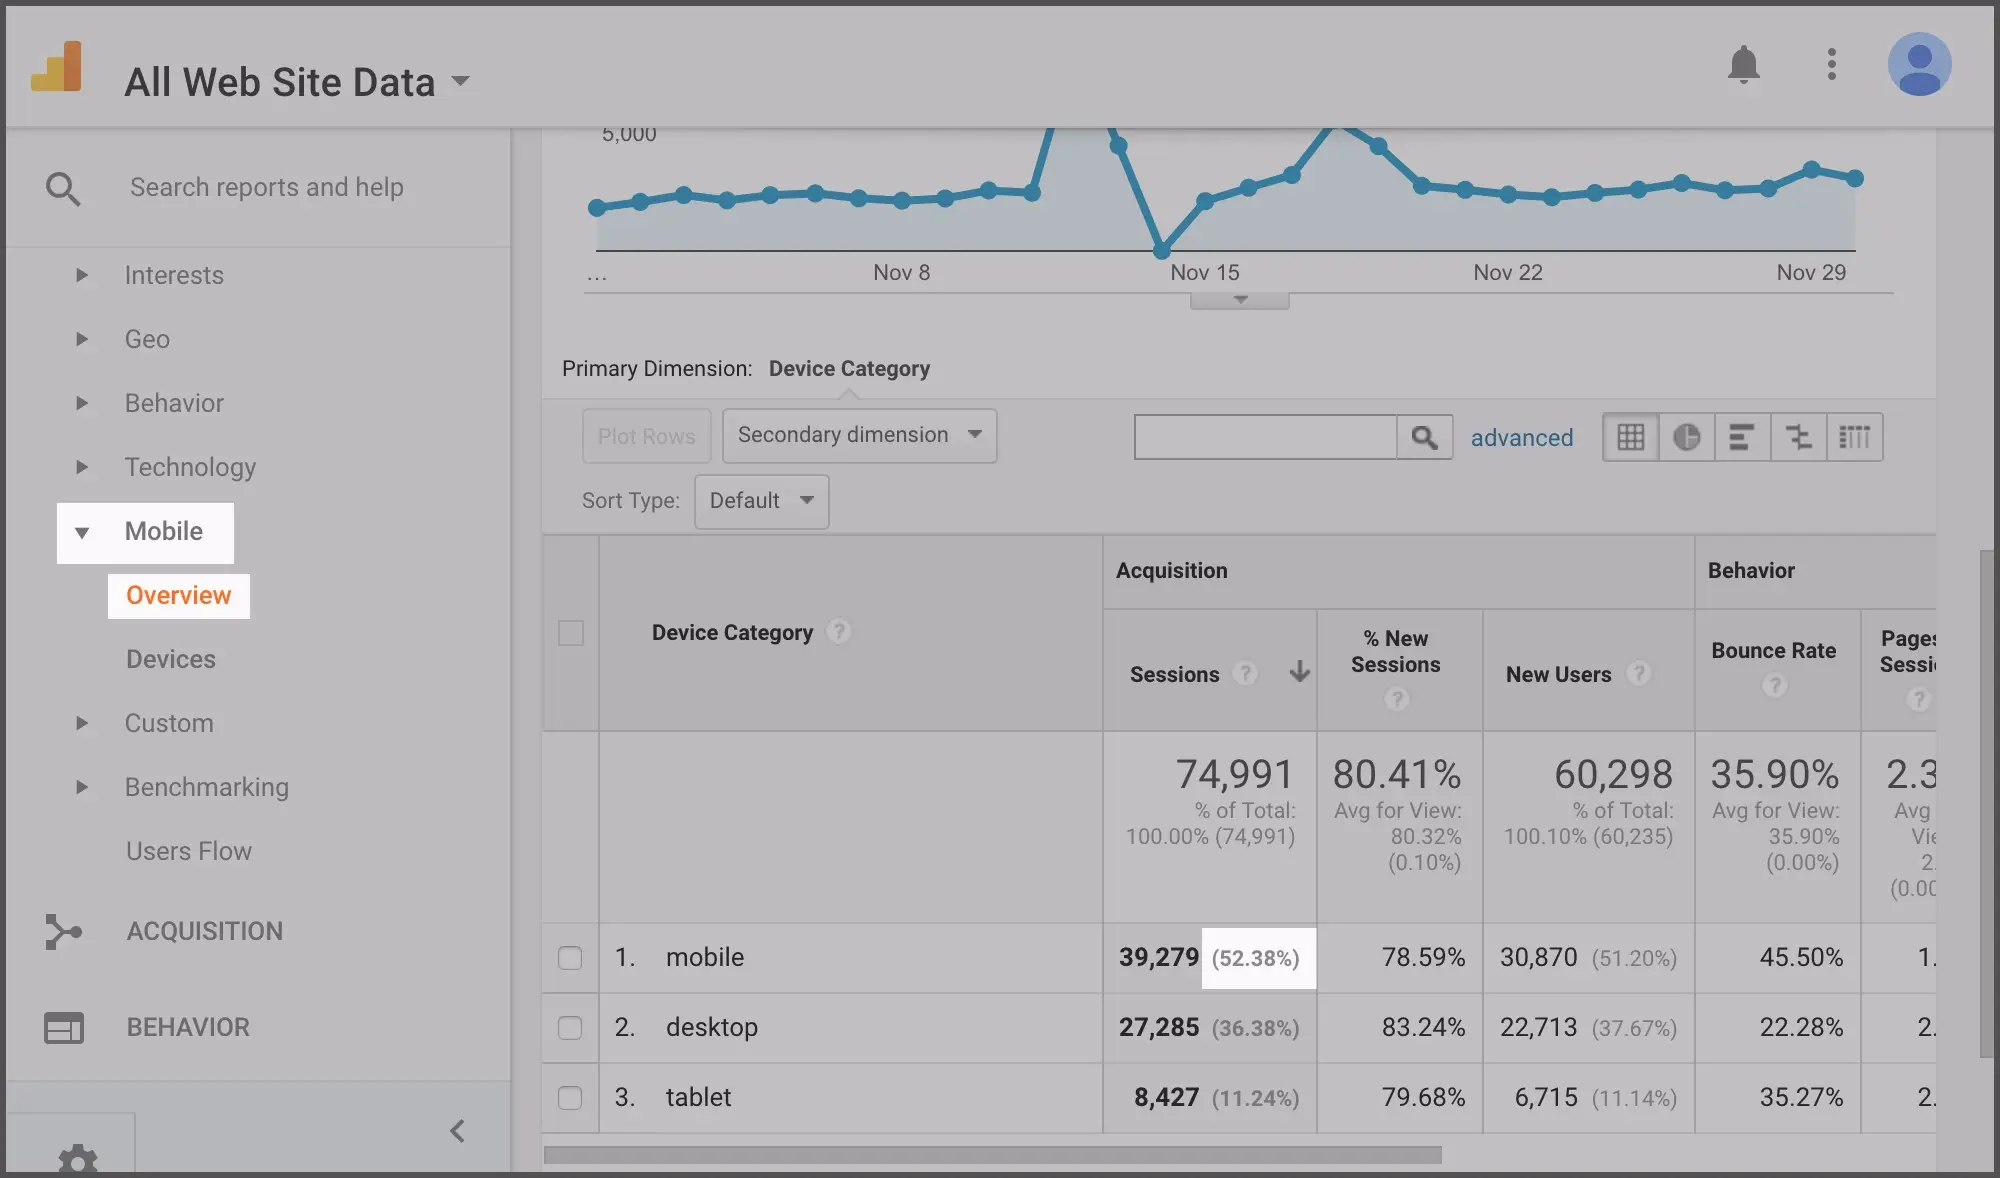
Next, under “Audience,” click “Mobile” and “Overview.” This will display the various devices on the right hand side of the screen. Under the "Sessions" column, you can see a breakdown of website sessions by device and the percentage of visitors coming from mobile, desktop and tablet.
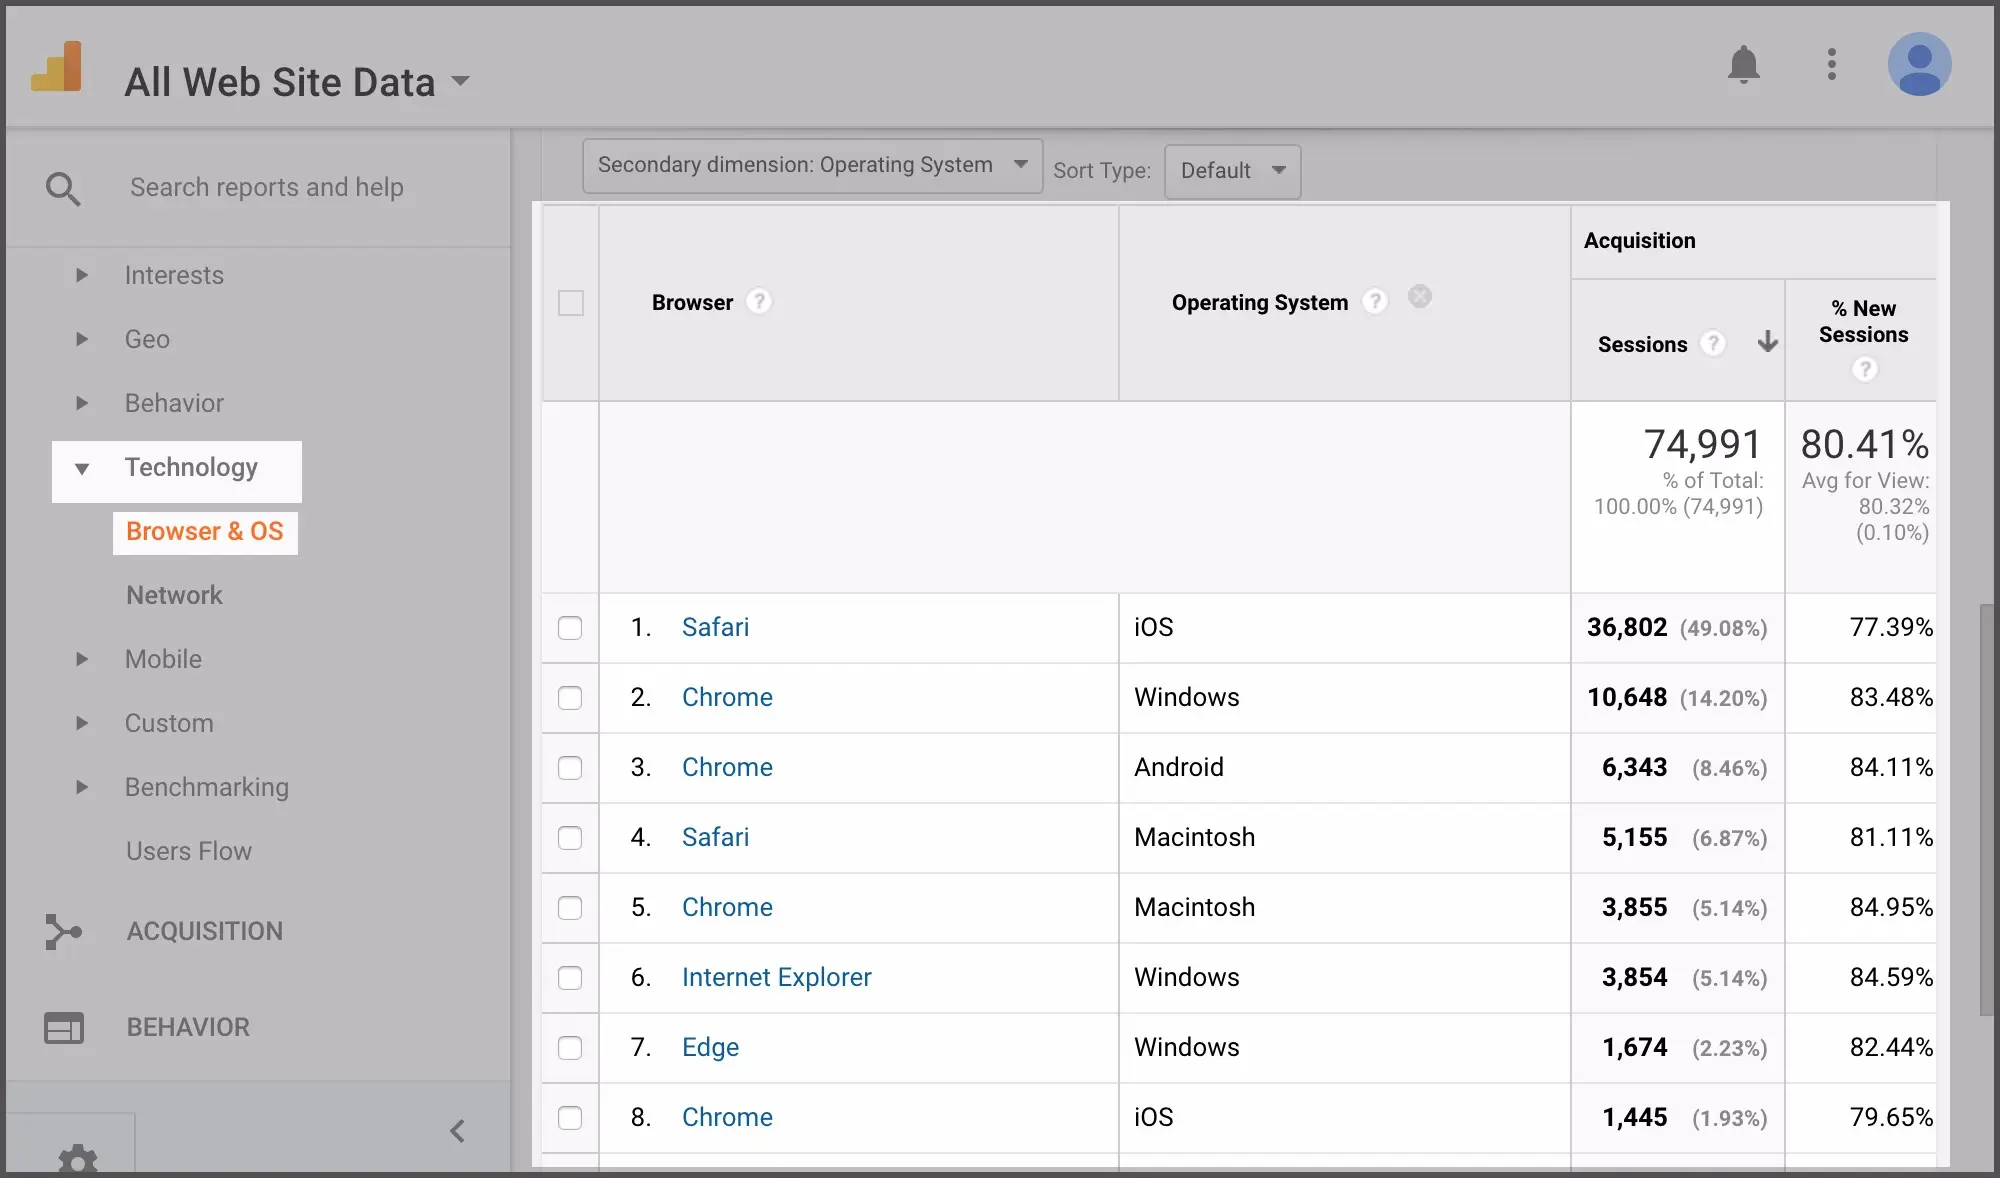
To get information about the browser (Safari, Chrome, Firefox, etc) and operating system (Mac or PC), click “Technology” on the left hand navigation, then select “Browser & OS.” You can see various browsers ranked in order of popularity on the right hand side of the screen.
If you have gotten customer complaints about your restaurant’s website on Firefox, for example, and you see a large number of visitors coming from there, it’s time to get those issues resolved to provide a better online experience for your guests.
Referral Traffic
Referral traffic is the last place website visitors were online before they came to your website through a direct link. Knowing how guests find your restaurant, and ultimately land on your website, is important so you can make sure that those channels have the most up-to-date and favorable information. For example, if you see a lot of traffic coming from Yelp, you should probably make sure that all of the information on your Yelp page is correct. Or if you get a lot of traffic from a particular media outlet, you may want to explore doing additional PR with that publication.
In order to see what websites are referring the most traffic to your restaurant, first click “Acquisition” on the left hand side. Then click “All Traffic” and “Referrals”.
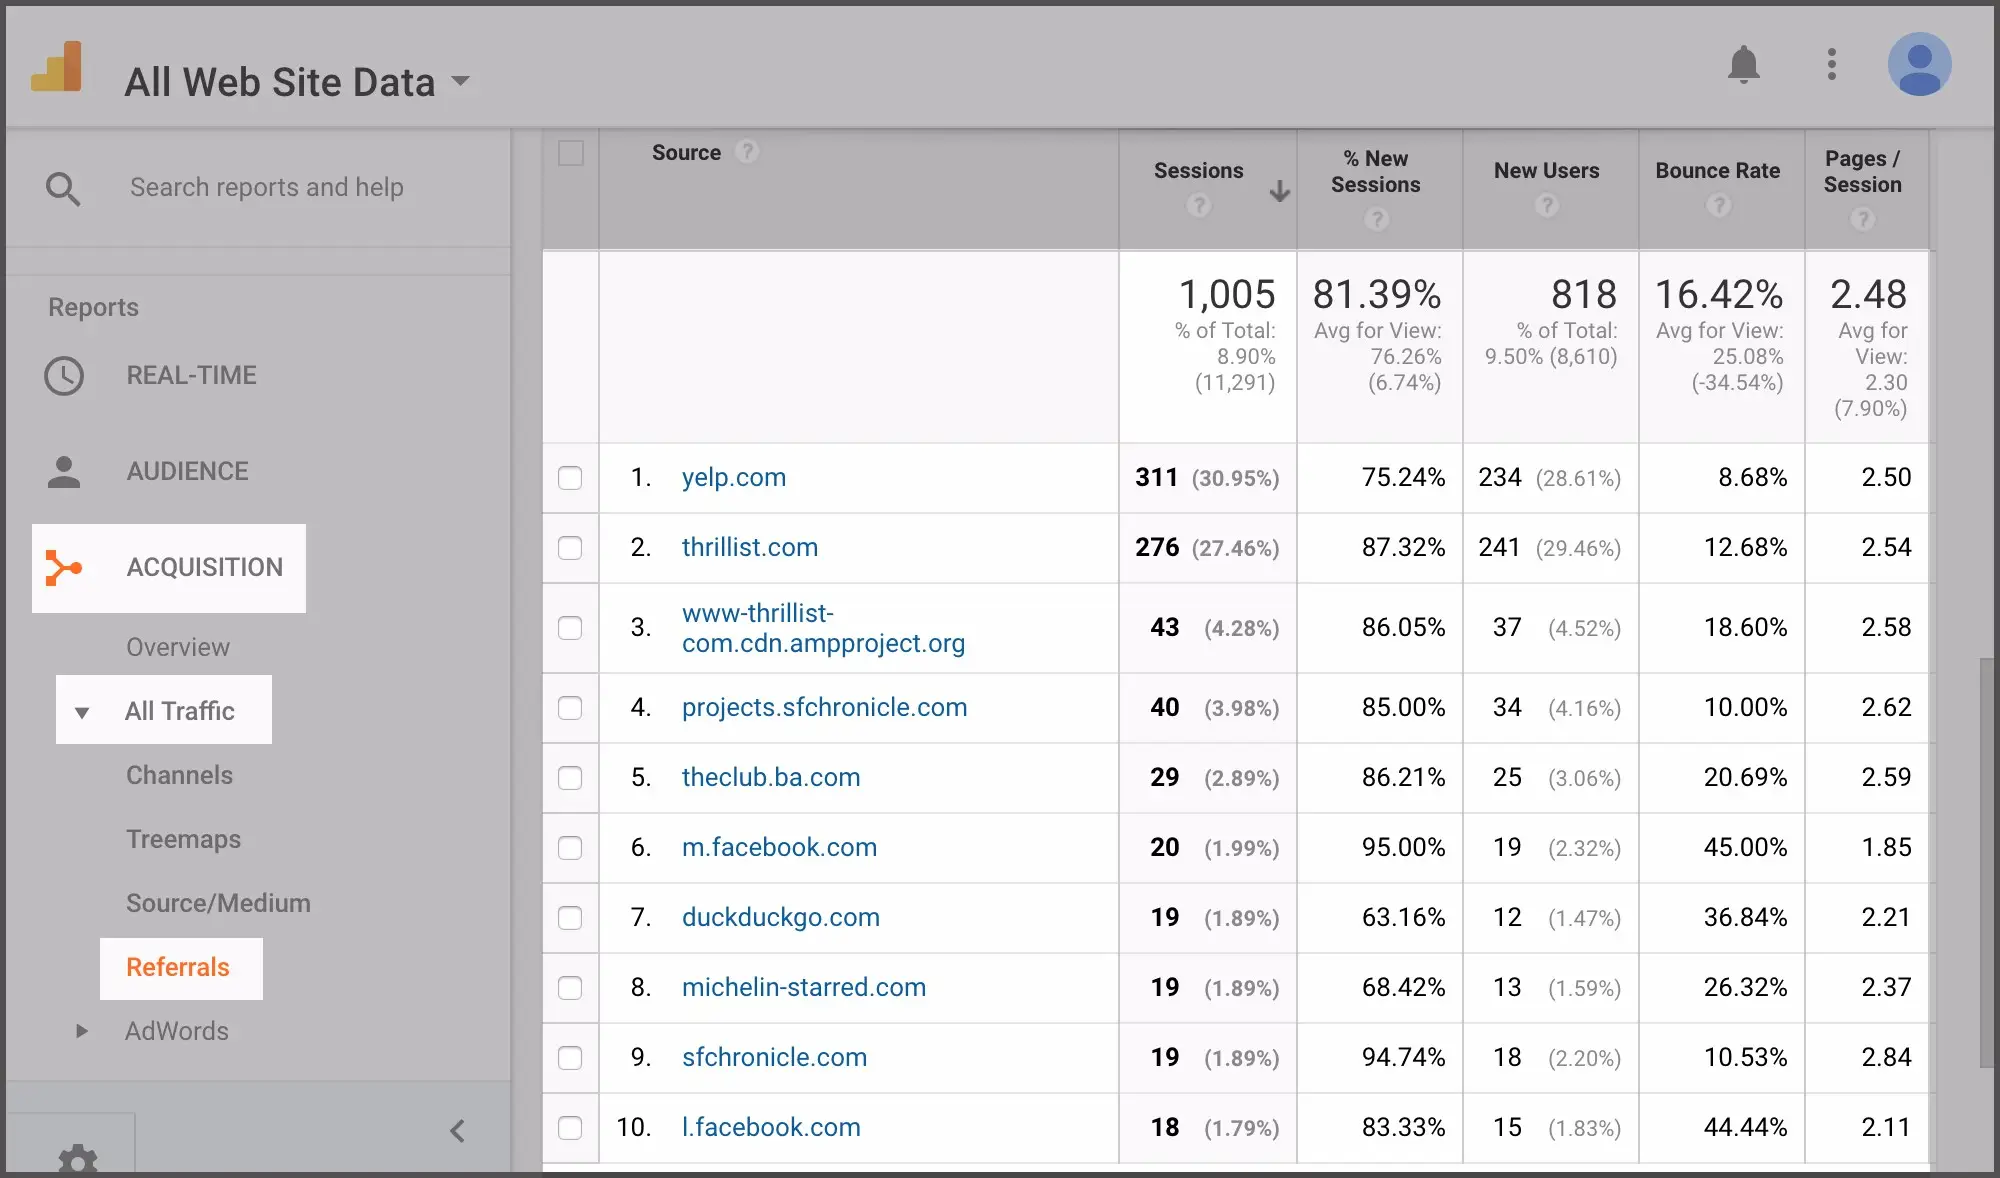
Here on the right side, you’ll easily see the top referring sites ranked in order of volume.
Time of Day
Understanding what time of day visitors are accessing your restaurant website can help inform your other online activity. For example, if you see that traffic spikes on your restaurant website around 4pm, as potential guests are weighing their dinner options, that may be the optimal time to do an Instagram post of your happy hour, or send an email blast with your specials for the evening.
Google Analytics doesn’t have time of day metrics built in, but there are some valuable add-ons that can provide this information to you in just a few clicks.
First, click on “Customization” on the left hand side and select “Custom Reports.” Once here, select “Import from Gallery” to load in a pre-created report.
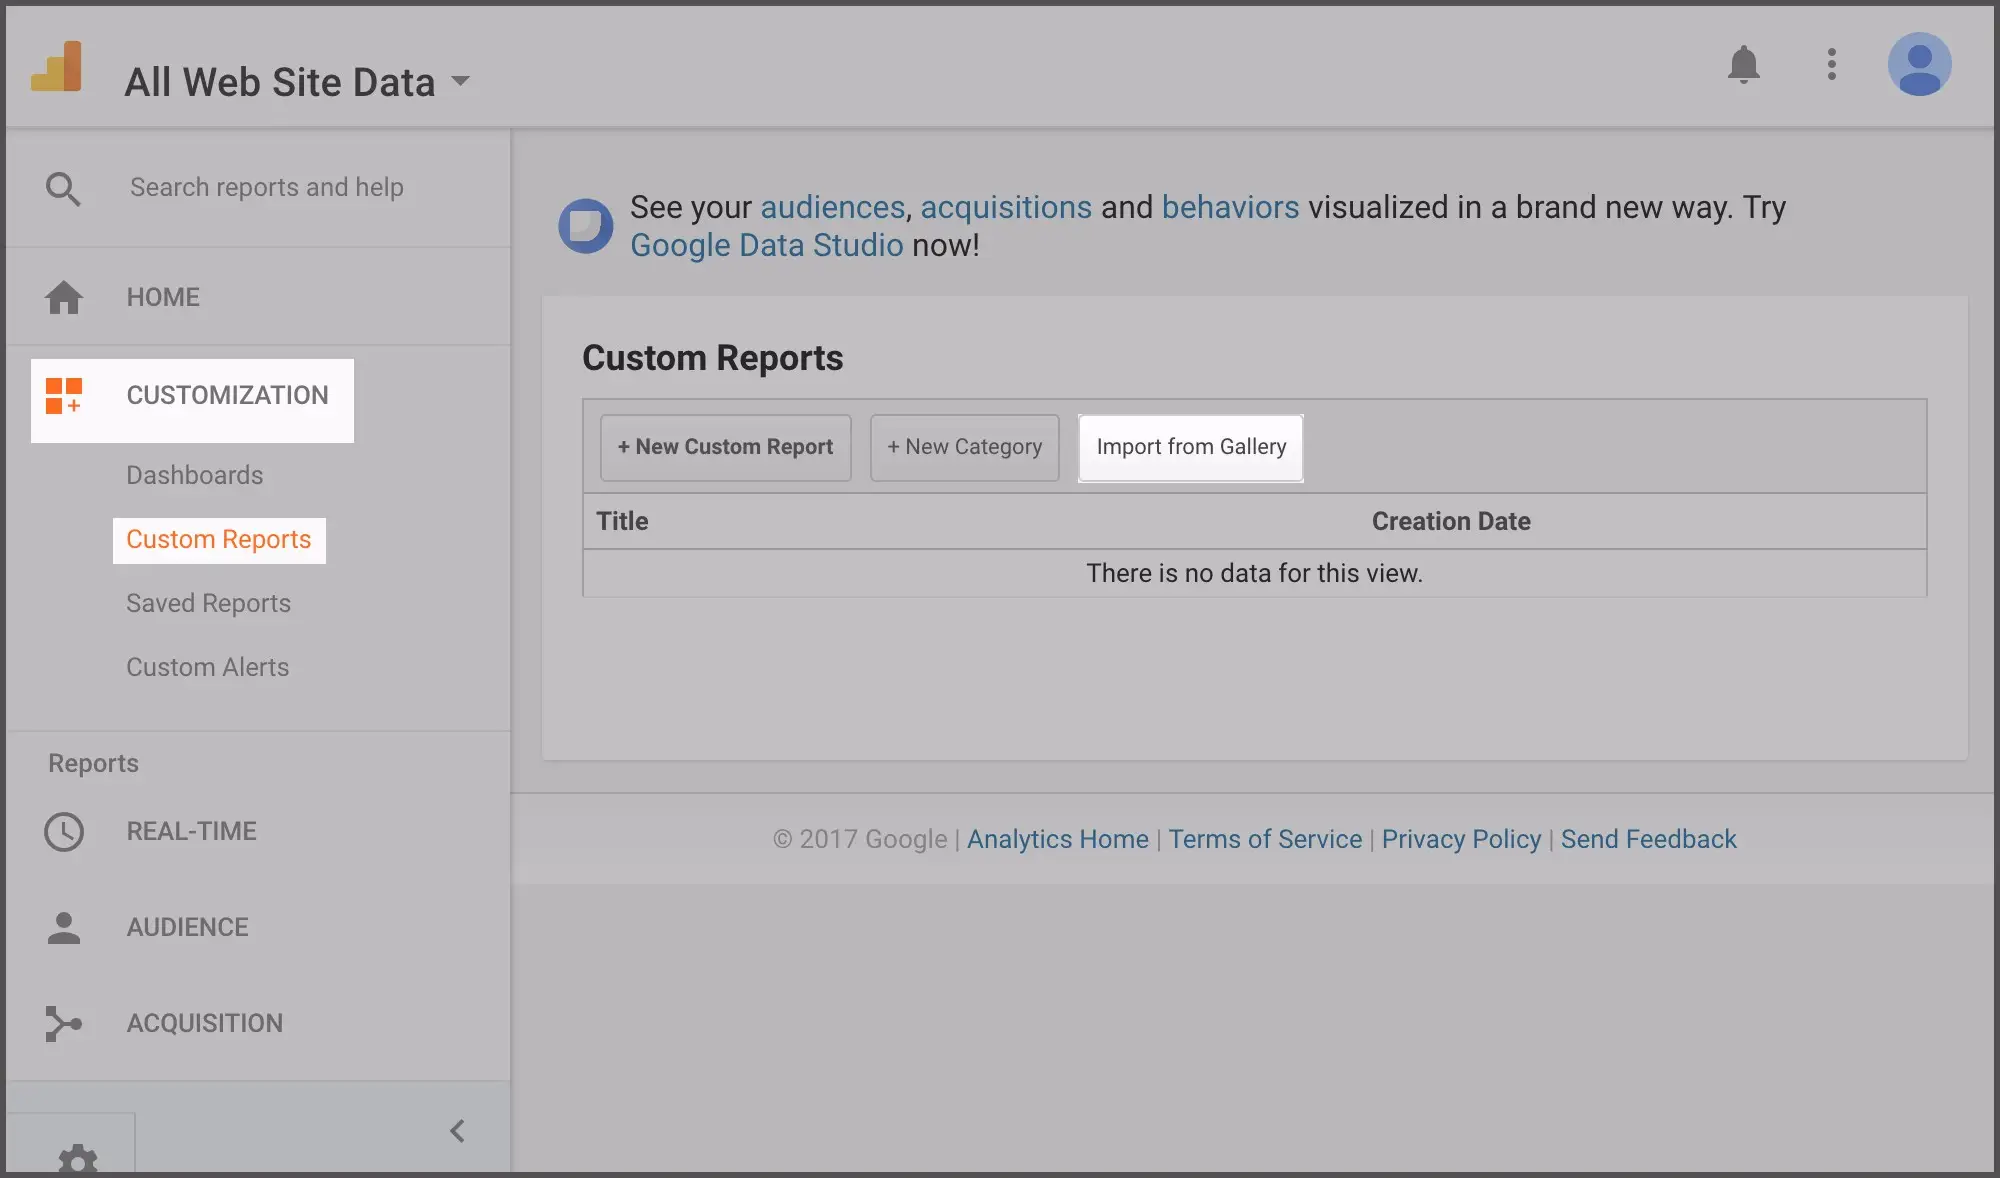
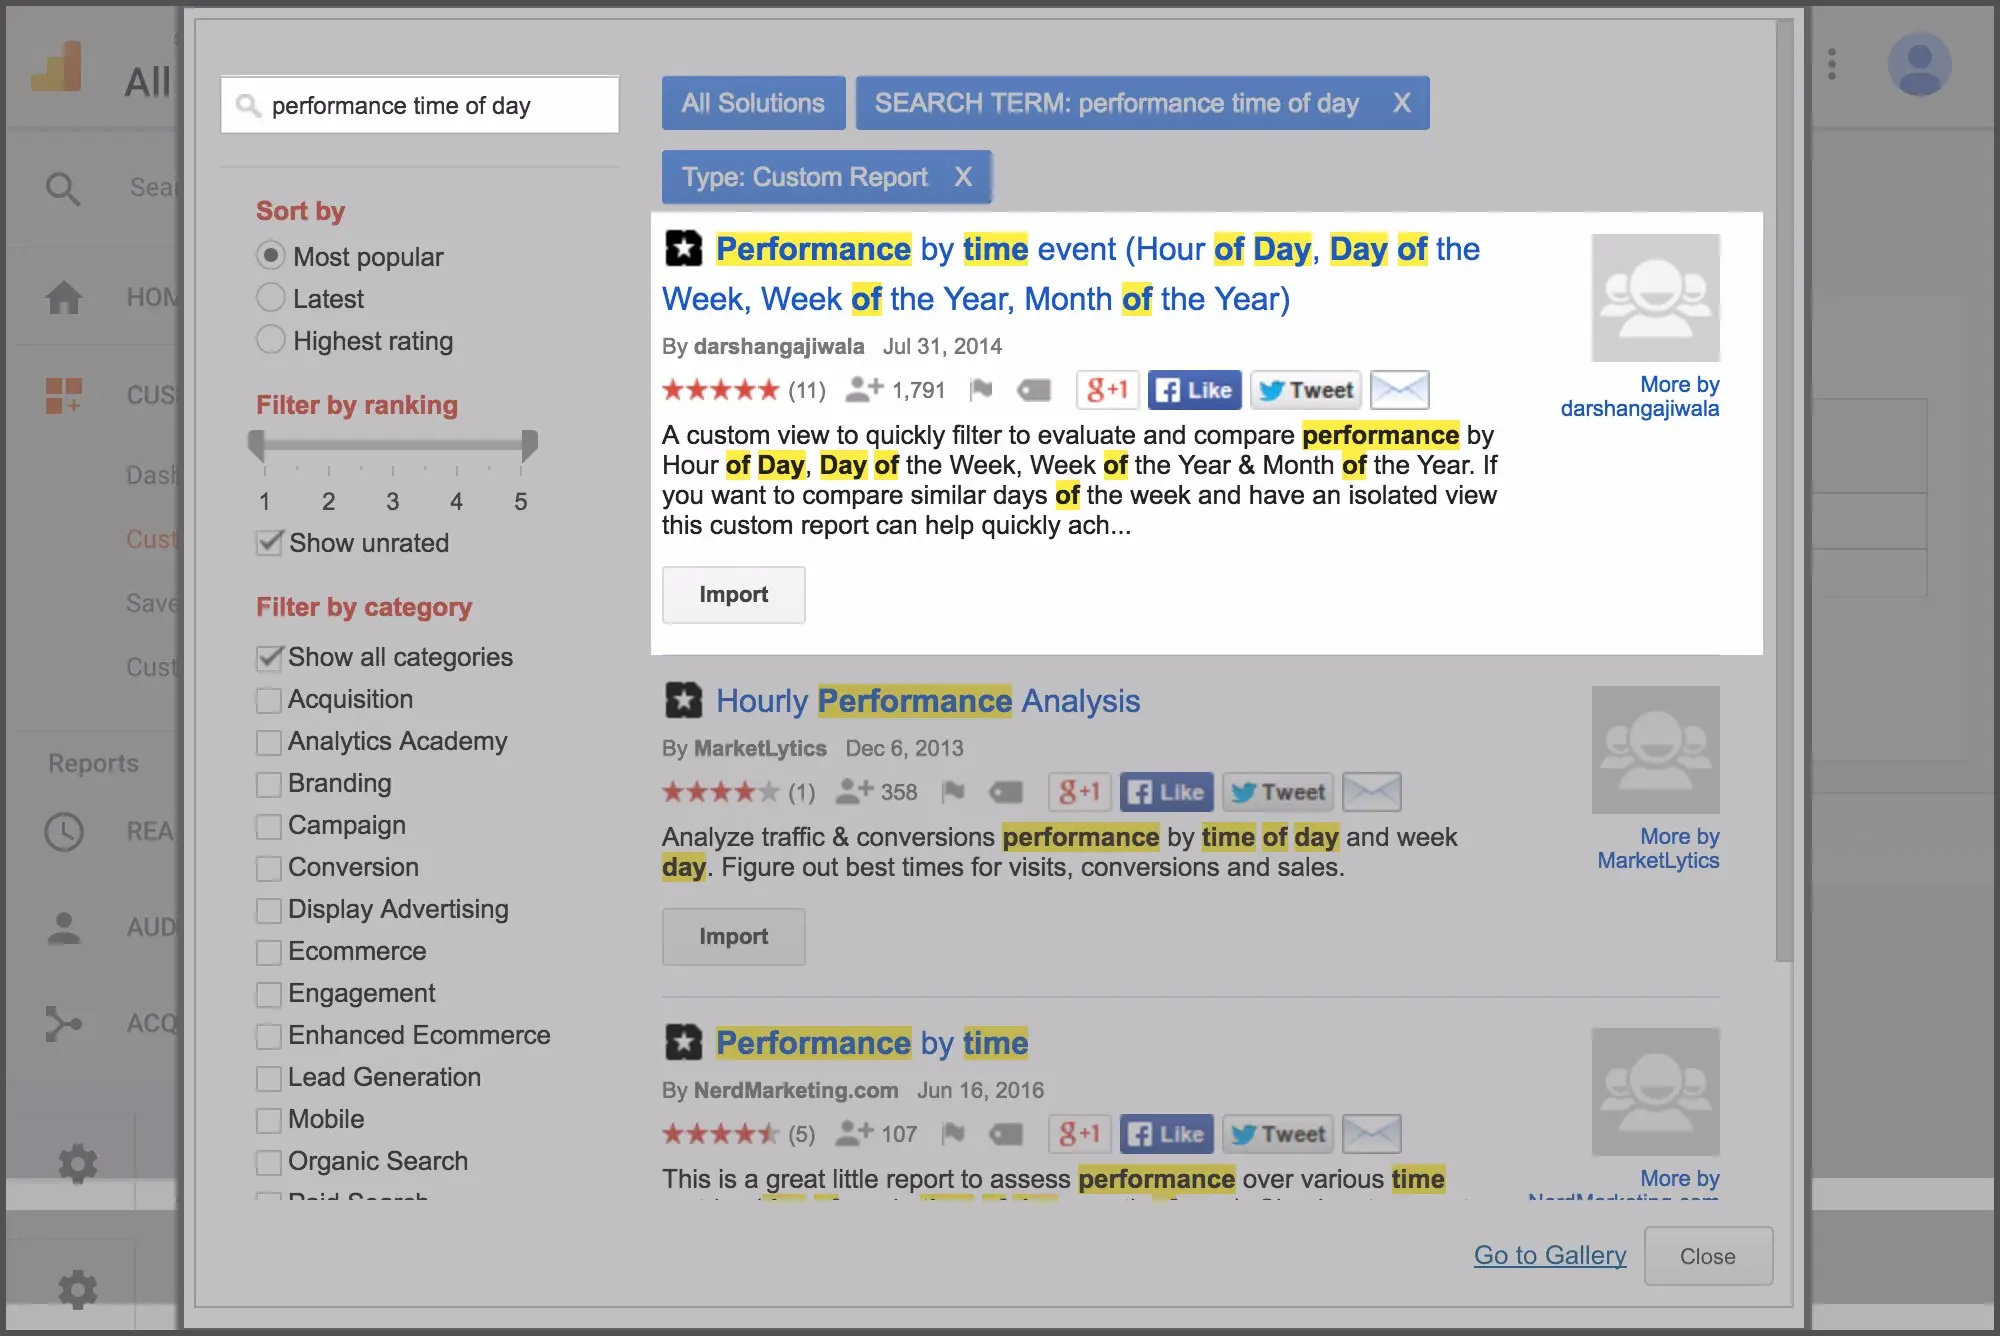
In the search box, search for "performance time of day" and import the first link titled "Performance by time event (Hour of Day, Day of the Week, Week of the Year, Month of the Year)."
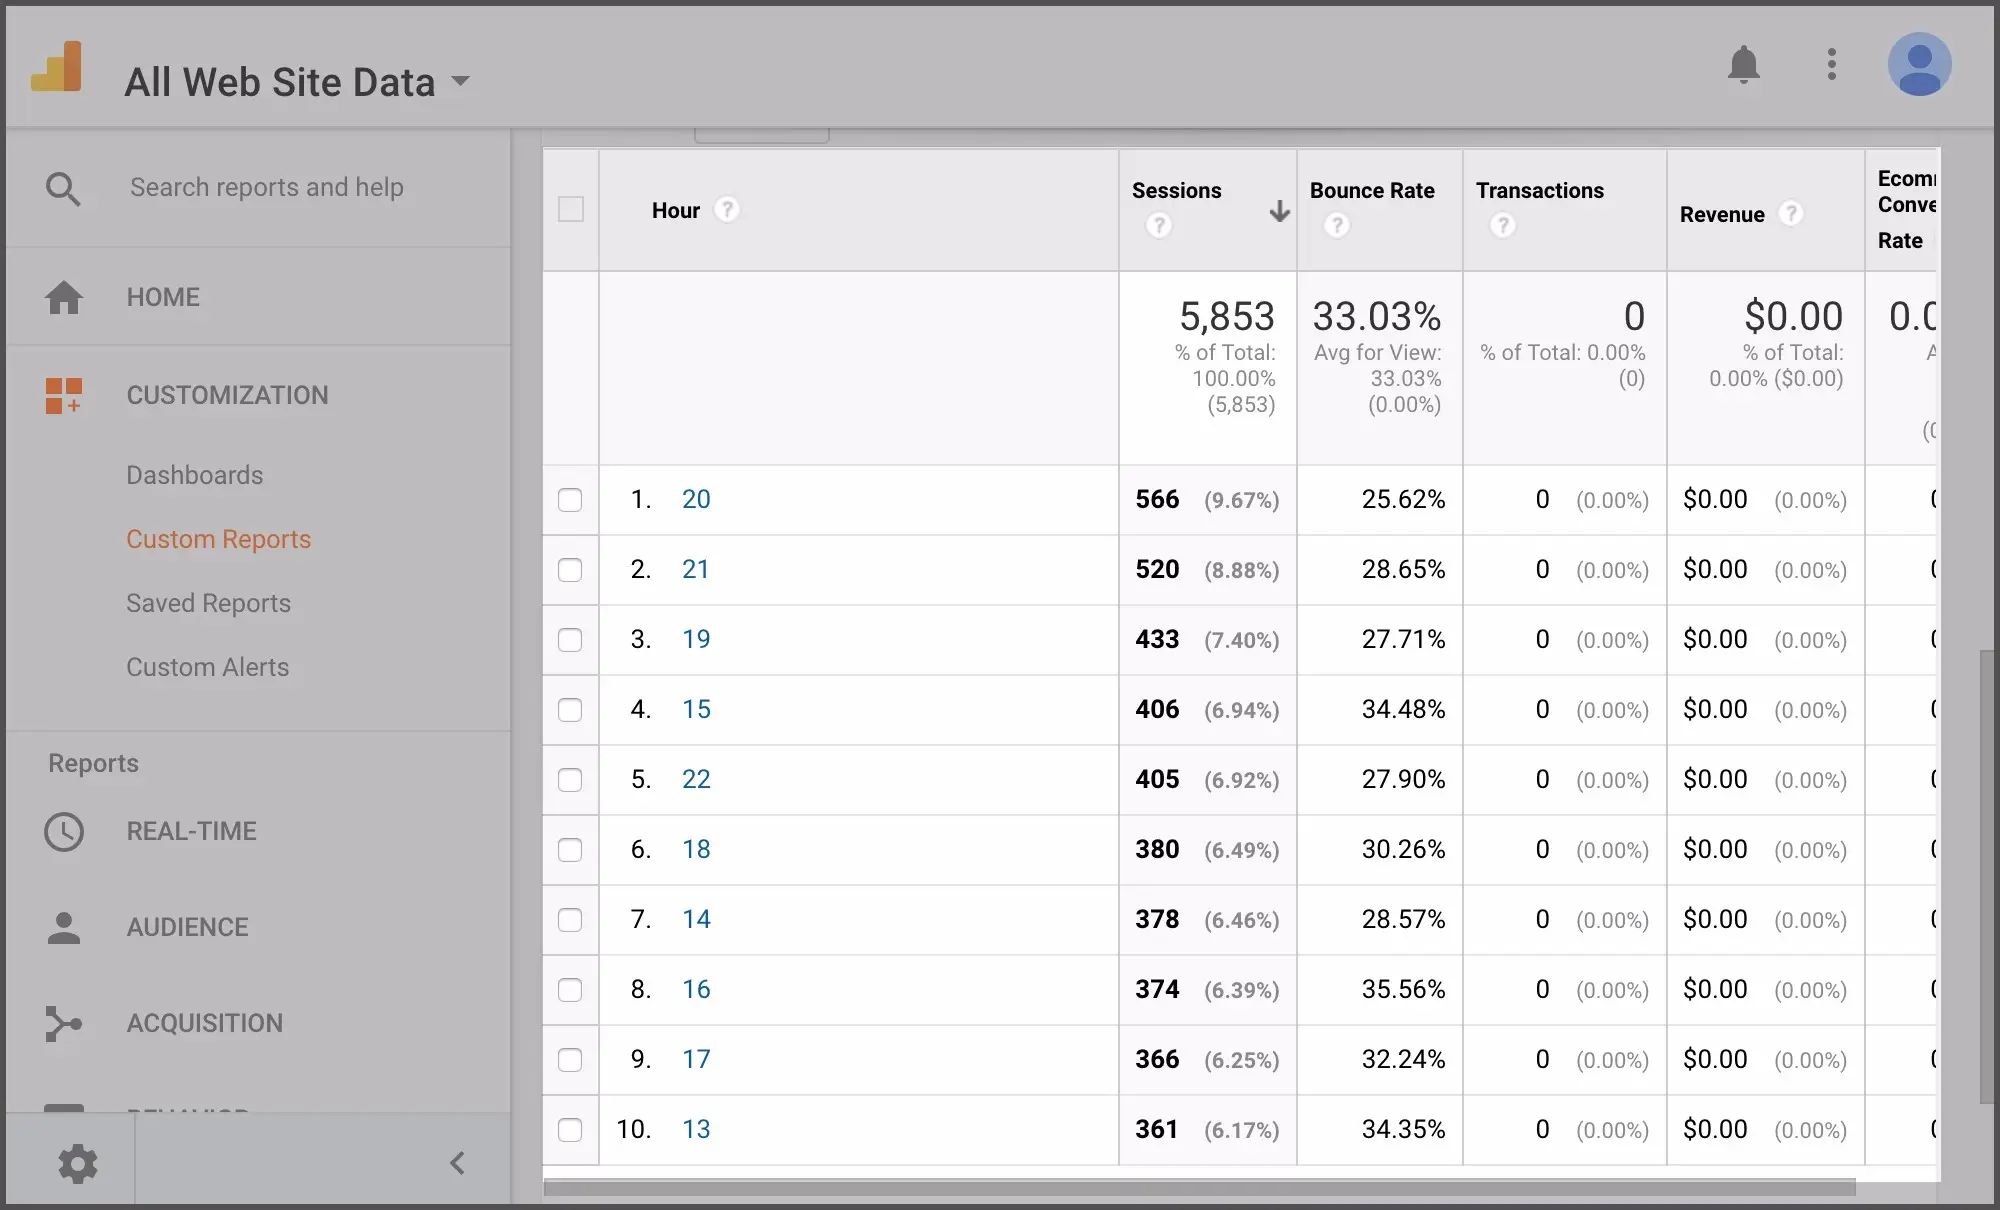
This will initially load in a list of numbers that represent the different days of the week, ranked from the busiest day to the day with the least acitivity.
To view visitor performance based on time of day, select the tab "Hour to Hour of Day." This will load a list of numbers that represent various hours throughout the day, ranked from busiest times to least busy times on a 24-hour clock.
Demographics
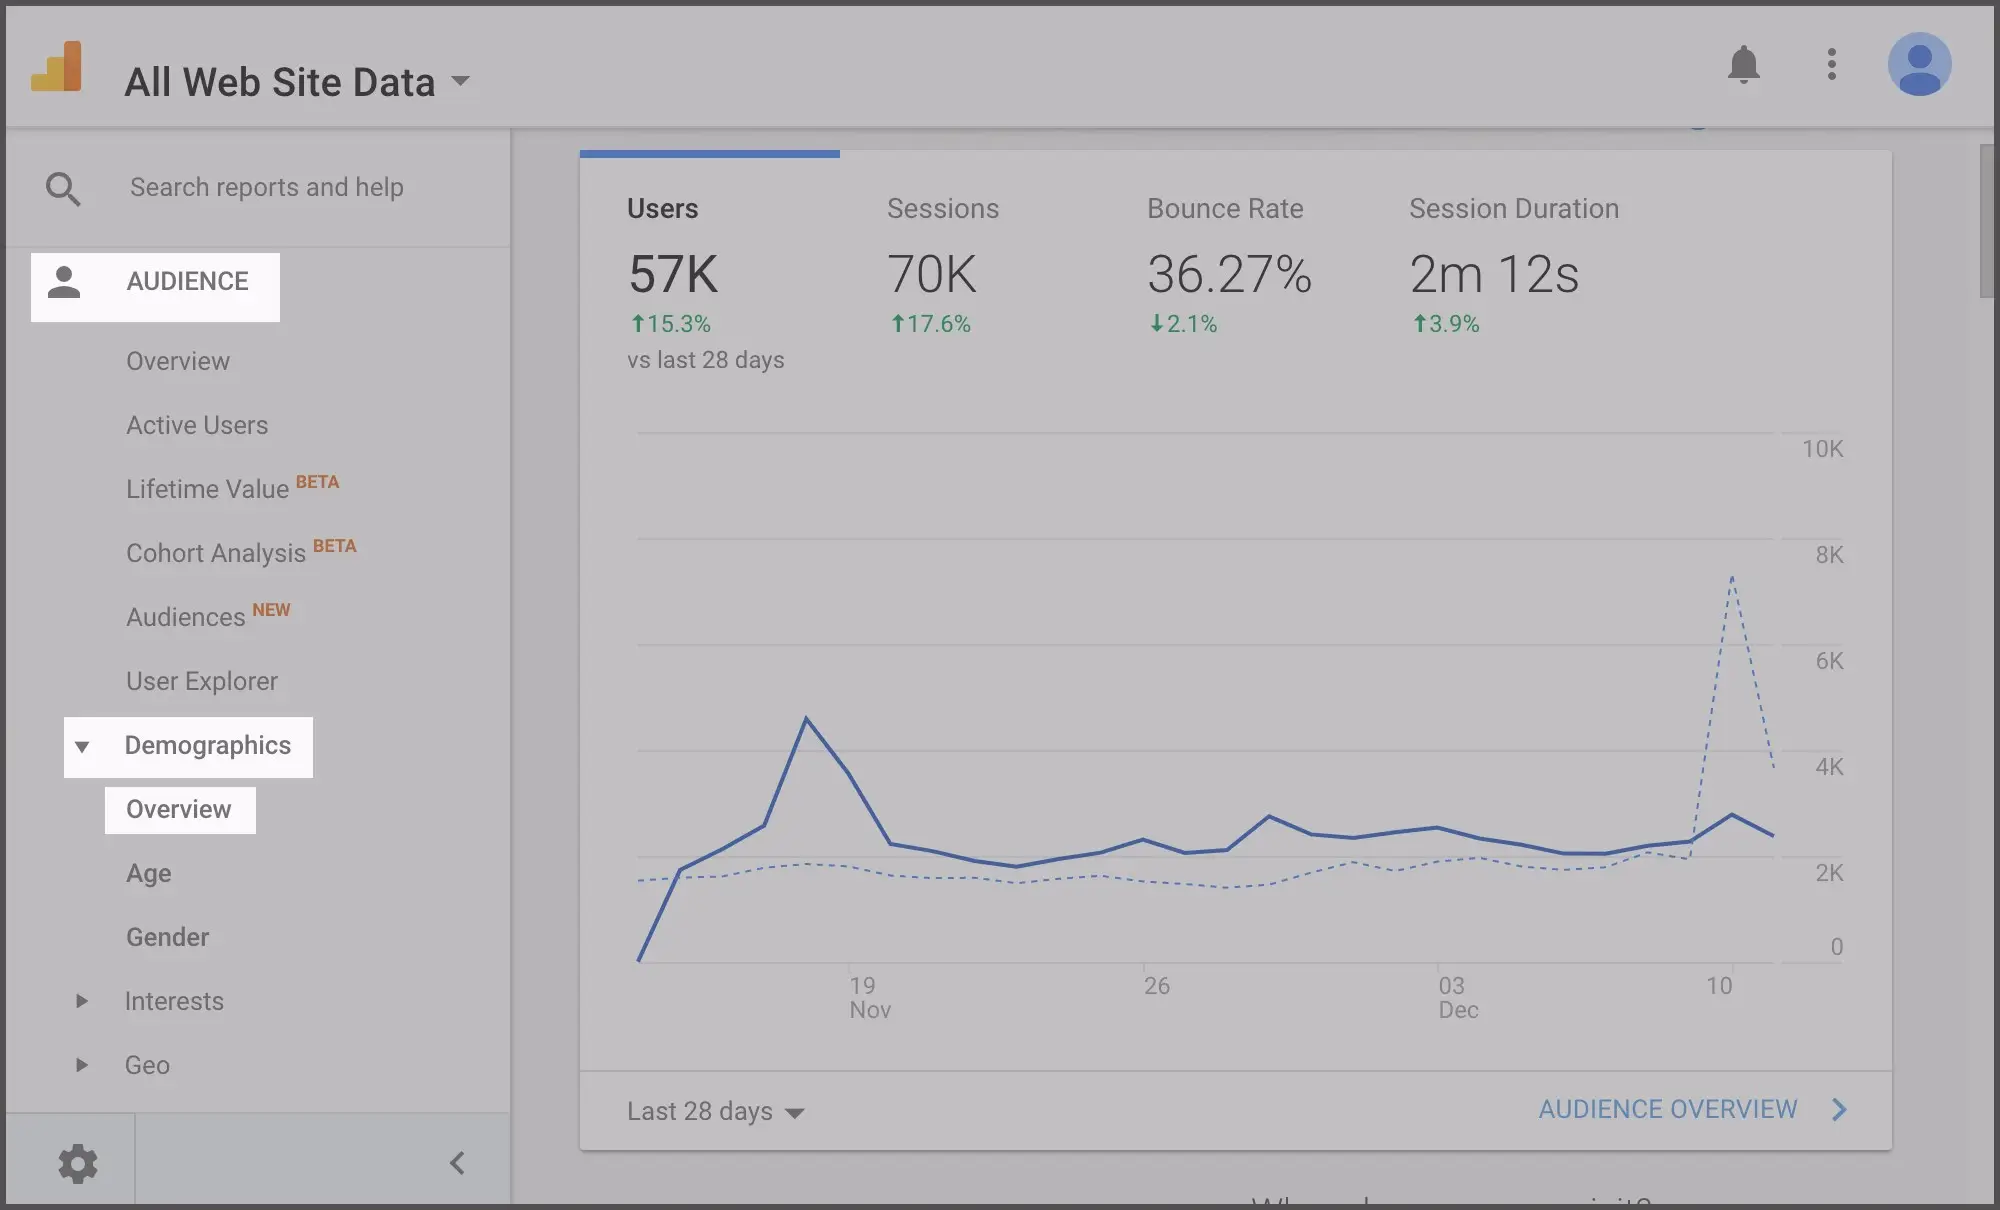
Knowing the age and gender of your website visitors can give you a better understanding of your brick-and-mortar guests. By default, Google Analytics doesn’t track this information, so below we’ll show you how to first turn on this feature.
First click on “Audience”, then “Demographics”, then “Overview.”
From there you will see a blue “Enable” button. Click on that to accept the terms and begin collecting information anonymously about your website visitors.
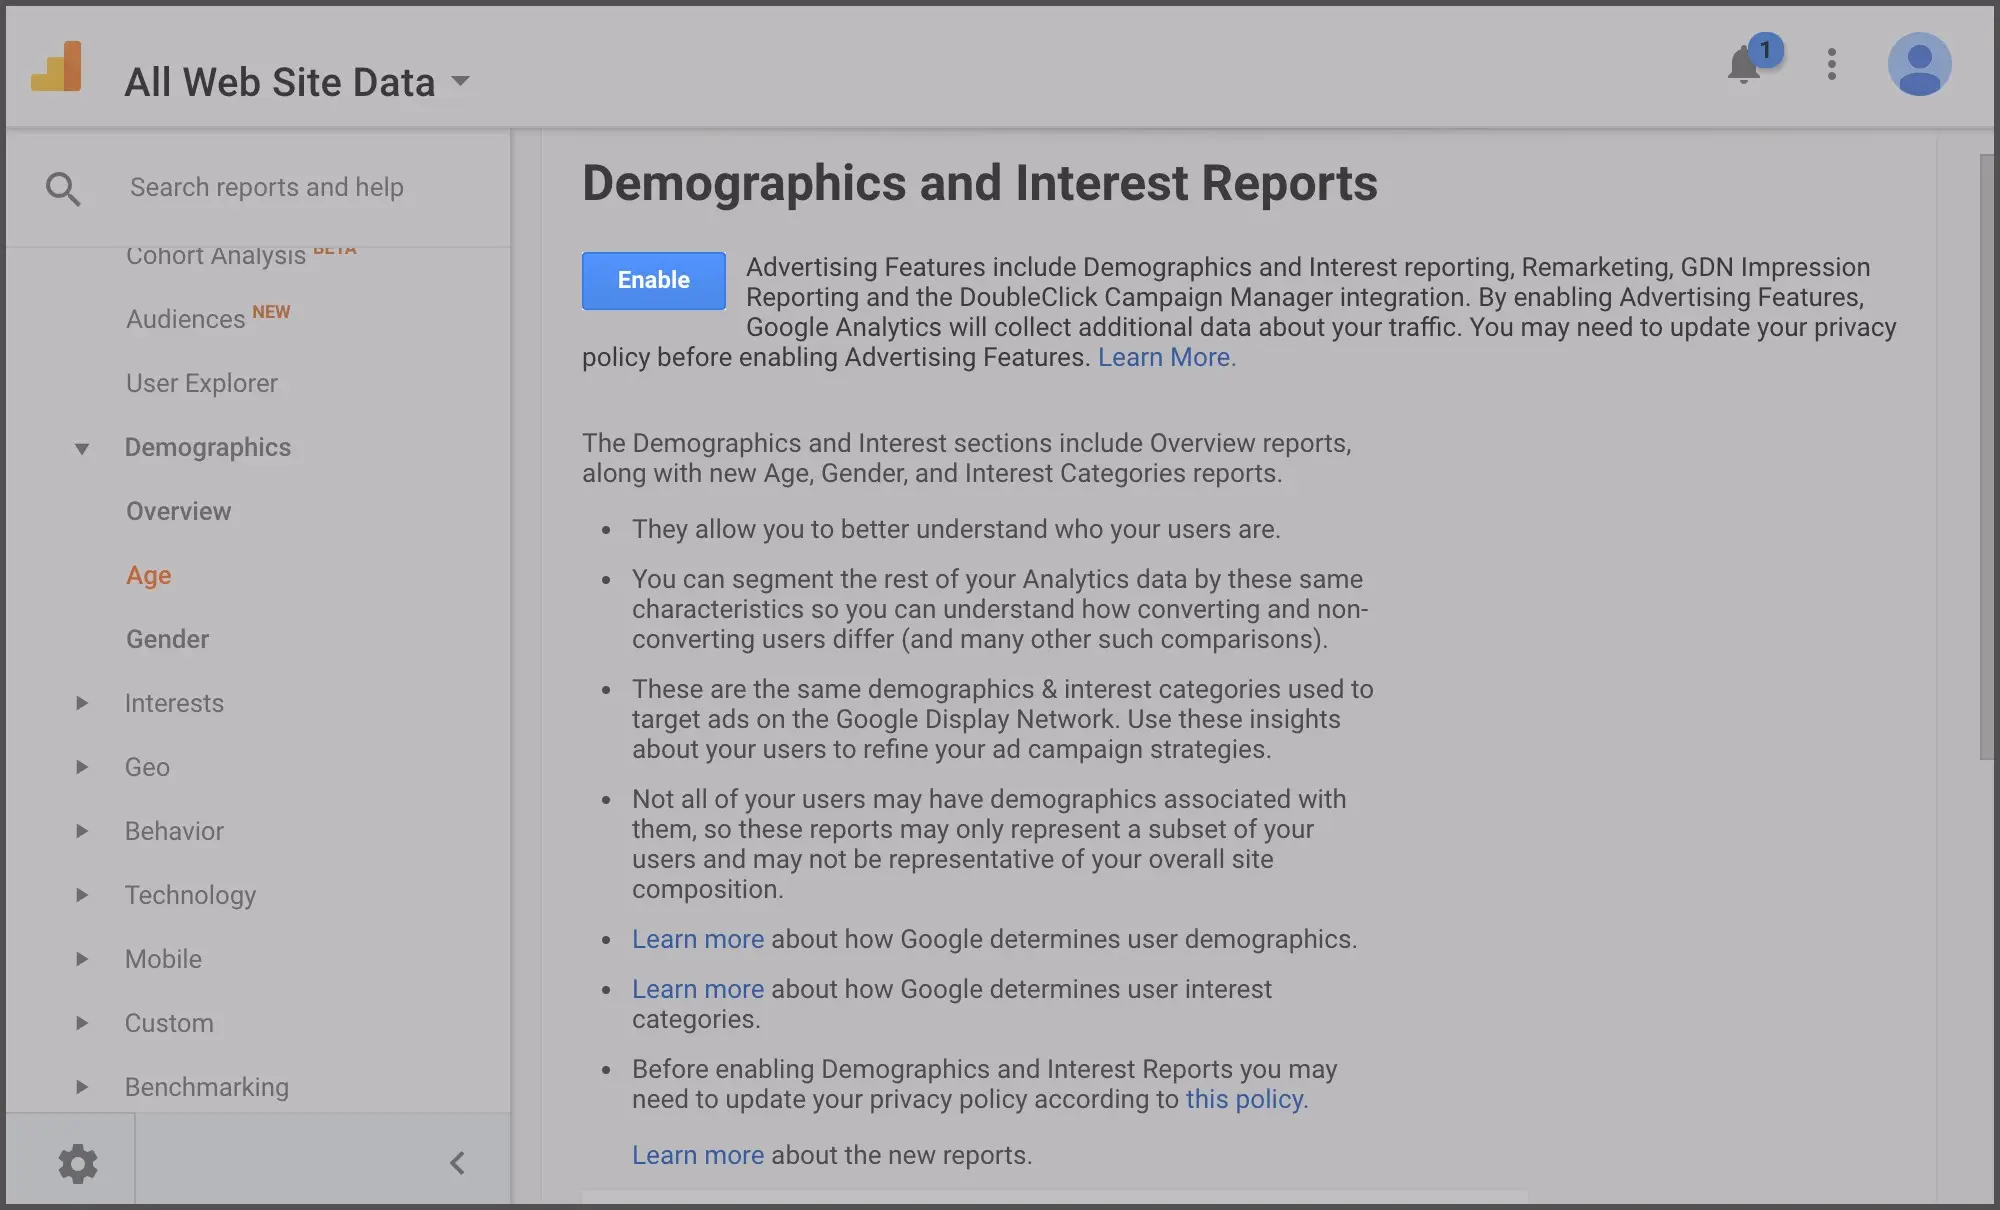
The content will need about a week or so to populate with meaningful information in this section.
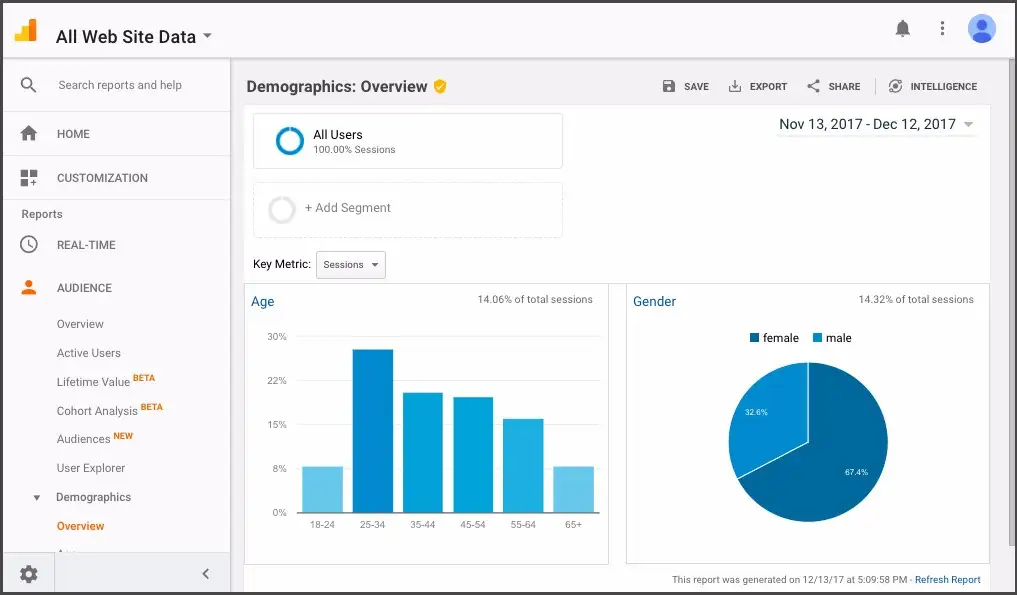
By understanding more about your restaurant website visitors and their digital behavior, you can make better decisions about your restaurant both online and off--that’s hospitality in all directions.
Recommended

Websites
5 Tools for Easy Restaurant Website Maintenance
April 13, 2017
A rundown of the BentoBox tools that make it easy to update your restaurant’s website quickly and keep it running smoothly.

Operations
Which Restaurant Reservation System Should You Use?
May 23, 2023
We compare BentoBox, OpenTable, Resy, SevenRooms, Tock, and Yelp.

Marketing
8 Easy Steps to Improve Your Restaurant SEO
March 10, 2023
Learn some best practices that restaurants can use to boost their local search rankings online and get more guests through the doors.
